FAQ for Fault Trace
1. How can I tell if my program is a HardFault?
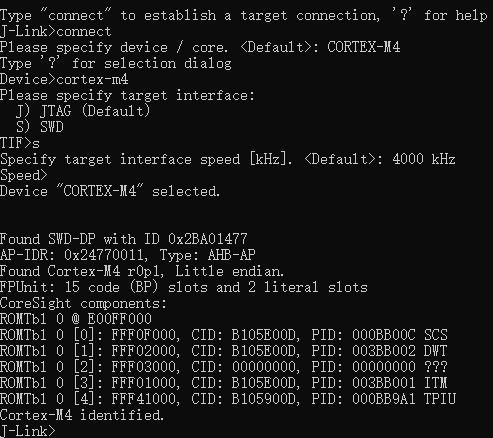
A: In the absence of a watchdog, when the system generates a HardFault, it will execute an endless loop in the interrupt handler. At this time, all modules, including Bluetooth LE, will not work properly, showing a “dead” effect. At this time, J-Link can be used to connect to the chip to determine whether a HardFault has occurred. After making sure the hardware is connected, open the J-Link Commander software, enter connect and press Enter, then Please specify device/ coreenter cortex-m4 and press Enter when prompted, enter s and press Return when prompted Please specify target interface, Enter 4000 at the prompt **Specify target interface speed [kHz]**and press Enter. At this time, the J-Link Commander will try to connect the chip, and it will be prompted Cortex-M4 identifiedafter success, as shown in the following figure:
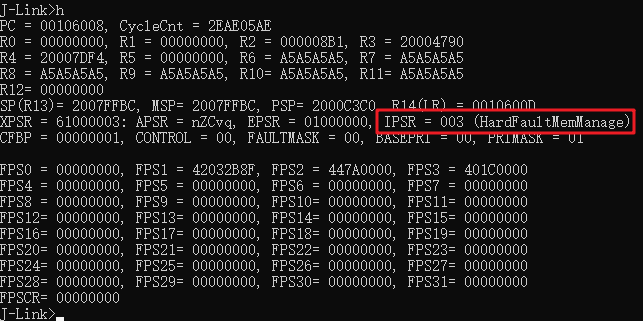
At this point, enter h and press Enter, and you can see the current interrupt from IPSRthe value of:
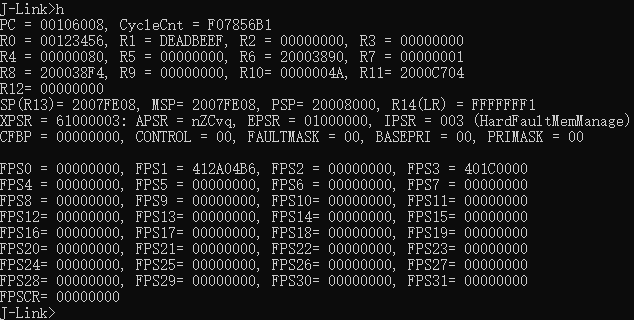
The interrupt number 003 represents the category that is currently in HardFaultMemManageand belongs to HardFault.
If the watchdog is used, it is very likely that the first scene is lost due to the reset of the watchdog. In this case, it is necessary to use the exception recording function of the Fault Trace module to judge. When a Hard Fault occurs, the Fault Trace module automatically stores the exception information in NVDS. Refer to GR5xx Fault Trace Module Application Notesthe chapter “Using the Fault Trace Module” for the import method of the module and how to read the stored error information.
2. Why does my program get HardFault?
A: The causes of HardFault are very diverse, and there is no universal answer. However, it can be analyzed with the help of the exception mechanism of Cortex-M4 core and some key clues. When the cortex-backtrace component of the Fault Trace module is used, the call stack information is automatically pushed back during HardFault. The following is the message output for HardFault after using the cortex-backtrace component:
Fault on interrupt or bare metal(no OS) environment
==== Main stack information ====
  addr: 2007fe28    data: 00000000
  addr: 2007fe2c    data: 00207379
  addr: 2007fe30    data: 00000301
  addr: 2007fe34    data: ffffff00
  addr: 2007fe38    data: 00240001
  addr: 2007fe3c    data: 01f40000
  addr: 2007fe40    data: ca3b0100
  addr: 2007fe44    data: 44501f80
  addr: 2007fe48    data: ffff0001
  addr: 2007fe4c    data: ffffffff
  addr: 2007fe50    data: ffffffff
  addr: 2007fe54    data: ffffffff
  addr: 2007fe58    data: ffffffff
  addr: 2007fe5c    data: ffffffff
  addr: 2007fe60    data: ffffffff
  addr: 2007fe64    data: ffffffff
  addr: 2007fe68    data: ffffffff
  addr: 2007fe6c    data: ffffffff
  addr: 2007fe70    data: ffffffff
  addr: 2007fe74    data: ffffffff
  addr: 2007fe78    data: ffffffff
  addr: 2007fe7c    data: ffffffff
  addr: 2007fe80    data: ffffffff
  addr: 2007fe84    data: ffffffff
  addr: 2007fe88    data: ffffffff
  addr: 2007fe8c    data: ffffffff
  addr: 2007fe90    data: ffffffff
  addr: 2007fe94    data: ffffffff
  addr: 2007fe98    data: ffffffff
  addr: 2007fe9c    data: ffffffff
  addr: 2007fea0    data: ffffffff
  addr: 2007fea4    data: ffffffff
  addr: 2007fea8    data: ffffffff
  addr: 2007feac    data: ffffffff
  addr: 2007feb0    data: ffffffff
  addr: 2007feb4    data: ffffffff
  addr: 2007feb8    data: ffffffff
  addr: 2007febc    data: ffffffff
  addr: 2007fec0    data: ffffffff
  addr: 2007fec4    data: ffffffff
  addr: 2007fec8    data: ffffffff
  addr: 2007fecc    data: ffffffff
  addr: 2007fed0    data: ffffffff
  addr: 2007fed4    data: ffffffff
  addr: 2007fed8    data: ffffffff
  addr: 2007fedc    data: ffffffff
  addr: 2007fee0    data: ffffffff
  addr: 2007fee4    data: ffffffff
  addr: 2007fee8    data: 20003384
  addr: 2007feec    data: 00000000
  addr: 2007fef0    data: 2000d46e
  addr: 2007fef4    data: 0020747d
  addr: 2007fef8    data: 00000002
  addr: 2007fefc    data: 00000000
  addr: 2007ff00    data: 00000000
  addr: 2007ff04    data: 00000007
  addr: 2007ff08    data: 00000001
  addr: 2007ff0c    data: 00000000
  addr: 2007ff10    data: 2000341c
  addr: 2007ff14    data: 00000008
  addr: 2007ff18    data: 002073b5
  addr: 2007ff1c    data: 00000008
  addr: 2007ff20    data: 00000e01
  addr: 2007ff24    data: 00209901
  addr: 2007ff28    data: 2000d450
  addr: 2007ff2c    data: 00209891
  addr: 2007ff30    data: 0000004a
  addr: 2007ff34    data: b0000000
  addr: 2007ff38    data: 00000002
  addr: 2007ff3c    data: 200012f4
  addr: 2007ff40    data: 00000e01
  addr: 2007ff44    data: 00000008
  addr: 2007ff48    data: ffffffff
  addr: 2007ff4c    data: 00040ee3
  addr: 2007ff50    data: 00000002
  addr: 2007ff54    data: 20001478
  addr: 2007ff58    data: 00000000
  addr: 2007ff5c    data: 0007e917
  addr: 2007ff60    data: 00000000
  addr: 2007ff64    data: 20001c9c
  addr: 2007ff68    data: 0007e948
  addr: 2007ff6c    data: 0007e948
  addr: 2007ff70    data: ffffffff
  addr: 2007ff74    data: 00040213
  addr: 2007ff78    data: 00000000
  addr: 2007ff7c    data: 002107bc
  addr: 2007ff80    data: 00000000
  addr: 2007ff84    data: 000817d1
  addr: 2007ff88    data: 00000000
  addr: 2007ff8c    data: 000817b1
  addr: 2007ff90    data: 002107bc
  addr: 2007ff94    data: ffffffe9
  addr: 2007ff98    data: 00000000
  addr: 2007ff9c    data: 00000000
  addr: 2007ffa0    data: 00000001
  addr: 2007ffa4    data: 00000003
  addr: 2007ffa8    data: ffffffff
  addr: 2007ffac    data: 0020b8c5
  addr: 2007ffb0    data: 0020b8c4
  addr: 2007ffb4    data: 61000000
  addr: 2007ffb8    data: 20003858
  addr: 2007ffbc    data: 0010747d
  addr: 2007ffc0    data: 00000001
  addr: 2007ffc4    data: 000996cb
  addr: 2007ffc8    data: 4000d000
  addr: 2007ffcc    data: 20003858
  addr: 2007ffd0    data: 20008170
  addr: 2007ffd4    data: 00106d3b
  addr: 2007ffd8    data: 00000001
  addr: 2007ffdc    data: 00000001
  addr: 2007ffe0    data: 00000000
  addr: 2007ffe4    data: 00106423
  addr: 2007ffe8    data: 200037c0
  addr: 2007ffec    data: 0009785d
  addr: 2007fff0    data: 002107bc
  addr: 2007fff4    data: 002107bc
  addr: 2007fff8    data: 00000000
  addr: 2007fffc    data: 0020b8c5
=========
==== Registers information =====
  R0 : 00123456     R1 : deadbeef
  R2 : 00000000     R3 : 00000000
  R12: 00000000     LR : 00077ded
  PC : 00203ca8     PSR: 61000011
=========
Fault reason:
Bus fault: imprecise data access violation
Call stack info : 00203ca8<--00077de9<--00207375<--000002fd<--00207479<--00000003<--002073b1<--00000dfd<--002098fd<--0020988d<--00000dfd<--00040edf<--0004020f<--0020b8c1<--0020b8c1<--
Cortex-backtrace mainly prints four messages: Stack data, Key Register, Exception type, and Call stack.
Among them, Stack datathe scene can be reproduced in combination with assembly, which is helpful for some HardFault debugging caused by data errors (such as division by 0, null pointer, etc.).
Key RegisterIncluding:
Registers for passing parameters, storing return values, and temporary data R0-R3
**R12 (IP)**Register used for temporary interprocedural parameter transfer
Register used to store the LRreturn address
Register used to store the PCcurrent running addr
Register for storing operation flag bit, interrupt number and operation status PSR
The PCregister allows you to know where the exception occurred. You can look up the assembly instructions for the corresponding address through the assembly file ( .s file or .asm file), or you can use the tools provided addr2line by the GCC tool chain to get which line in which source file the address corresponds to. Sometimes you can see that PCthe value is an odd number, which is caused by the Thumb mode of the Cortex-M4 core. In this case, the address value -1 is the correct address.
Exception typeIs a resolution of the registers of the **CFSR(Congifurable Fault Status Register)**Cortex-M4 core. This register is used by the Cortex-M4 core to indicate the cause of a HardFault. HardFault is subdivided into 3 types: Usage Fault, Bus Fault, Memory Management Fault. Please refer to the Cortex-M4 Devices Generic User Guide”Configurable Fault Status Register” “section for the specific types and the specific meanings of the instructions.
Call stackIt is the calling relationship chain obtained by the Cortex Backtrace module through the analysis and reverse deduction of registers, running programs and stack data. As with PCregister values, the entire call chain can be located in conjunction with an assembly file or addr2line tool.
3. Can I analyze the above without using the Cortex Backtrace component?
A: Yes. The main function of Cortex Backtrace is to push back the call stack. If you do not use the Cortex Backtrace component, but only use the exception recording function of Fault Trace, you can do this after the Hard Fault occurs. Use GRToolbox or GProgrammer to read the exception information stored in the chip, for example:
HARDFAULT CALLSTACK INFO: R0-00123456 R1-DEADBEEF R2-00000000 R3-00000000 R12-00000000 LR-00077DED PC-00203C00 XPSR-61000011
Since the Cortex Backtrace component is not used, Fault Trace only records information from key registers. At this time, it can also be analyzed by combining the value of the sum before PC****LRthe exception with the or addr2line of the assembly file.
4. If you don’t use the Fault Trace module, can you analyze HardFault?
A: Yes. However, if you do not use the Fault Trace module, you need to keep the Hard Fault site to obtain the necessary information. If the site is reserved, J-Link can be used to connect the chip for analysis. The specific process is as follows:
Firstly, the stack pointer used at the site where the exception occurs is judged according to LRthe value of the register:
| FPU used before interrupt | FPU not used before interrupt — | — | — In Handler Mode before interrupt, use MSP| 0xFFFFFFE1 | 0xFFFFFFF1 Use MSP in Thread Mode before interrupt| 0xFFFFFFE9 | 0xFFFFFFF9 Use PSP in Thread Mode before interruption| 0xFFFFFFED | 0xFFFFFFFD
Similarly, take the previous Hard Fault as an example, use J-Link to connect the chip and read the field:
As you can see from the figure, the stack pointer used before the exception occurred is MSP = 0x2007FE08.
After determining the stack pointer, read 8 words (32 Bytes) from the stack pointer. When an interrupt occurs, the Cortex-M4 presses the stack in the following order: xPSR, PC, LRR12R3R2R1****R0, Then the meaning of the eight words read is reversed. The sixth word is before the PCexception, and the seventh word is before LRthe exception. These two values can be used to deduce the position before the exception occurs. Read here using the instructions of the J-Link Commander
mem32:
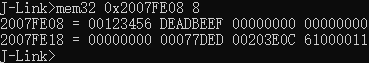
It can be seen LR = 0x00077DEDfrom the figure that PC = 0x00203E0C..
Combined with assembly files or addr2line tools, specific locations can be located for analysis.
5. What’s going on when the PC points to an inexplicable place?
A: There are several possibilities. First, it is possible to call an illegal address, where the value is more LRimportant than PCthe position before the jump, such as when the function pointer is null or an illegal value. Second, maybe MSP and PSP are reversed, so the PC and LR are the wrong values. Third, for the GR5xx SoC, some codes are solidified into the ROM. In some cases (such as illegal parameters), the codes in the ROM may generate Hard Fault. At this time, the PC value is 0x00000000between and 0x000FFFFF(the ROM address range of different SoC models is different. Please refer to the Datasheet of the corresponding model for the specific scope).
6. What if I can’t read the data on the stack?
Please make sure that the chip has been stopped by Halt, that is, after J-Link is connected, you need to input
hto stop the chip.Check that the stack pointer being read and the length to be read are in the correct RAM range.
If none of the above steps can solve the problem, it is possible that the chip has a hardware exception. Please check whether the power supply and key power signals meet the requirements, or contact FAE for technical support.